
News
2026-03-07

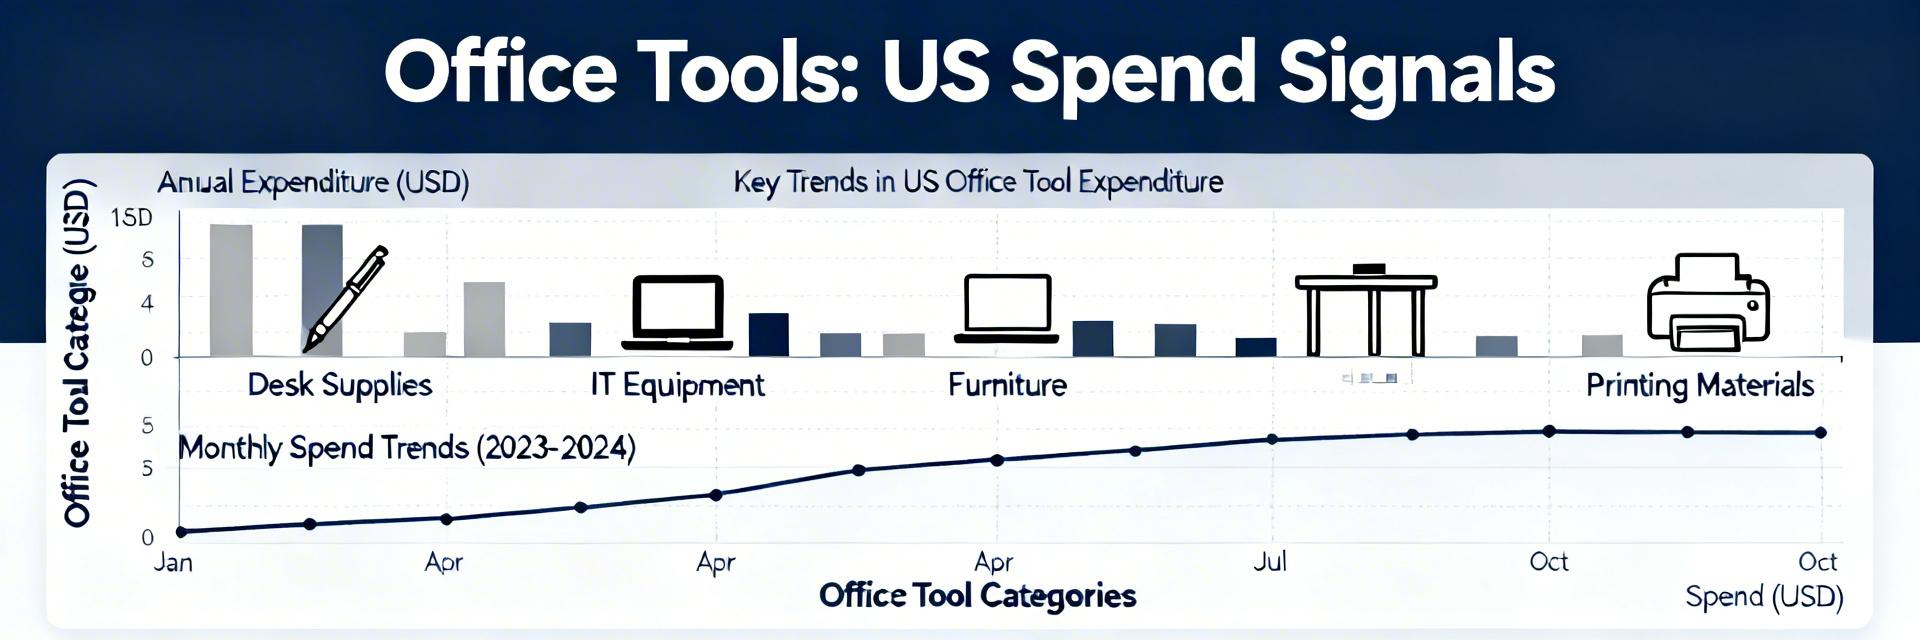
Latest market indicators show a clear uptick in office tools adoption across U.S. organizations — and that shift is driving measurable increases in IT and SaaS spending. This brief quantifies US spending patterns, surfaces leading adoption signals, and offers actionable guidance for buyers and vendors focused on procurement and value realization.
"The analysis synthesizes public fiscal datasets, survey signals and vendor telemetry patterns to identify where dollars flow and which operational signals presage expansion. The aim is practical: help procurement teams and go‑to‑market leaders convert signals into prioritized actions."
Hybrid work normalization, rapid AI augmentation, and heightened security and compliance demands are reshaping procurement priorities. These macro drivers push organizations to favor subscription models, integration capability, and measurable productivity gains—core themes in contemporary office software trends for hybrid work.
Scope here includes collaboration platforms, productivity suites, task/project tools, document automation, and workplace AI assistants. Excluded are infrastructure platforms and vertical‑specific ERP systems. This scoping keeps the analysis focused on tools that directly change end‑user workflows and procurement decisions.
| Metric | Legacy Suites (Pre-2020) | Modern AI-Enhanced Stacks | User Benefit |
|---|---|---|---|
| Deployment | On-prem / Monolithic | Cloud-Native / Modular | 99.9% uptime, access anywhere |
| Integration | Closed ecosystems | Open API / Low-code | 30% faster cross-app workflows |
| Intelligence | Static Templates | Generative AI / Predictive | Reduces drafting time by 50% |
| Security | Perimeter-based | Zero-Trust / DLP Native | Lower compliance risk exposure |
Surveys indicate SMBs are increasing per‑seat spend modestly, mid‑market firms show faster expansion via integrations, and enterprises concentrate spend on licenses plus customization. Professional services, finance and healthcare appear as the heaviest vertical spenders based on procurement notices and public budget signals.
"When auditing US spending, we often see a 'shadow IT' gap. Organizations typically pay for 15% more licenses than they actively use. My advice: implement automated de-provisioning for users inactive for >45 days. This alone can recover 5-8% of the annual software budget."
— Dr. Alistair Vance, Senior SaaS Infrastructure Architect
Pro Implementation Tip:
Budgets typically split across subscriptions (50–60%), integrations/implementation (15–25%), security/compliance (10–15%), and training/enablement (5–10%). Recent signals show rising allocations toward AI augmentation and automation infrastructure as buyers prioritize time‑to‑value and risk reduction.
Key measurable signals include license growth rates, renewal/expansion rates, API call volumes and integration activity, endpoint provisioning, internal enablement programs, and hiring postings for platform expertise. Each metric can convert to a short checklist for analysts to monitor month over month.
Hand-drawn sketch, non-precise schematic
Emerging office software trends in the US point to embedded AI assistants, document automation, async collaboration primitives, and security‑first features. For vendors that demonstrate clear TCO and automation ROI, demand signals accelerate; buyers must weigh feature maturity against compliance needs.
Track active users, feature adoption rate, time‑to‑value, renewal/expansion rates, integrations per customer, and automation run rates. Compute these as rolling 90‑day cohorts and benchmark against internal baselines to spot positive or negative momentum in office tools adoption.
Use vendor telemetry, procurement records, finance spend data, job postings, third‑party surveys and IT inventories. Practical plan: define scope → collect raw signals → normalize by user base → benchmark versus peers → report with signal prioritization for action.
Example allocation: licenses 55%, integrations 20%, security 12%, enablement 8%, contingency 5%. SMBs can run a 90‑day pilot then scale; enterprises typically use phased 6–18 month rollouts with center‑led governance. Align procurement timelines with fiscal quarters to secure renewals.
An SMB often starts with a defined pain (inefficient docs), pilots a single team for 30–90 days, invests in focused enablement, then scales to adjacent teams. Quick wins include template automation and standardized integrations; common pitfalls are poor change management and underfunded training.
Enterprises favor procurement committees, phased rollouts, strong integration investments and centralized enablement. Success hinges on cross‑functional governance, pilot validation of TTV, and linking vendor performance to renewal/expansion metrics tracked by procurement and IT.
Align tools with workflows, measure adoption KPIs, prioritize integrations, invest in enablement, budget for automation, and negotiate expansion terms tied to outcomes. Track these actions against quarterly targets to ensure budgeted spend converts into measurable user productivity.
Monitor adoption signals, package services around integrations and enablement, highlight TCO and time‑to‑value in case studies, and target verticals showing strong procurement signals. Use expansion and renewal data to prioritize accounts ready for upsell.
Measure with a combination of active users, feature adoption rates, time‑to‑value metrics and renewal/expansion figures. Normalize these metrics per 1,000 seats and track in 90‑day cohorts.
Rising license counts, increased API/integration calls, and expanded enablement programs indicate growing US spending. Job postings for platform skills are also key secondary signals.
Adopt a template allocating majority to subscriptions, a material share to integrations, and explicit funds for security and enablement. Run pilots tied to KPIs to validate spend.
US spending on office tools is trending upward, with budgets shifting toward licenses, integrations and AI‑driven automation. The most reliable adoption signals are license growth, renewal/expansion rates and integration telemetry, which together flag accounts primed for further investment.
Buyers should run adoption audits, establish KPI dashboards, and reserve integration and enablement budgets to capture time‑to‑value. Vendors and analysts can convert these signals into GTM advantage by packaging integration‑led services and clear TCO narratives.


{{ boxName }} ({{ dataList?.length || 0 }} Items)
{{ val.manufacturer || val.en_manufacturer || '' }}
auto.lang_Quantity: {{ val.quantity }}
auto.lang_null