
News
2026-03-07

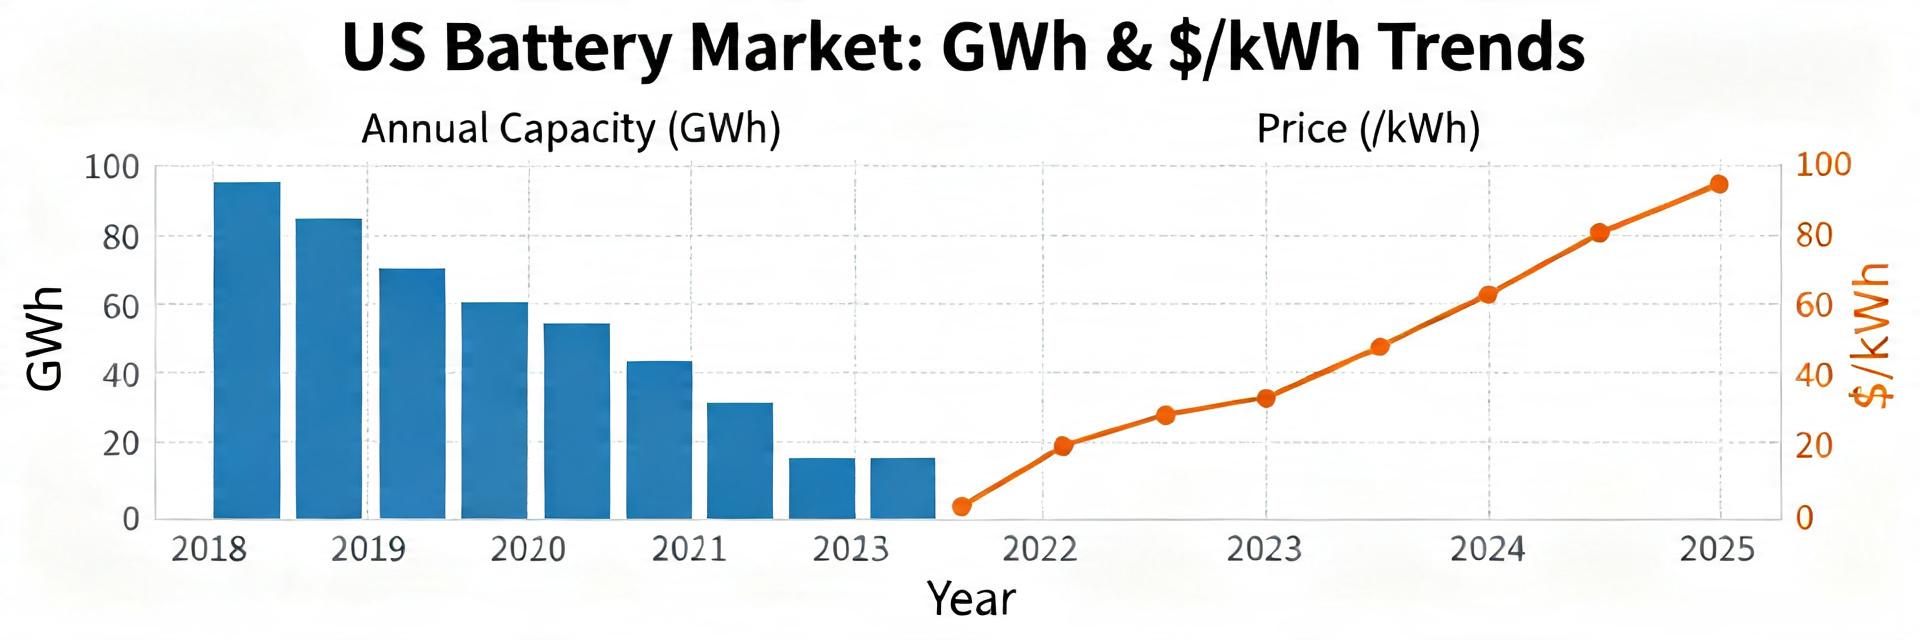
U.S. battery installation capacity increased by roughly 58 GWh in the most recent full year while headline average pack prices fell near 10% year-on-year. For producers and utilities, this translates to lower CAPEX for energy storage projects and improved margins for EV manufacturers.
“Battery market” here covers EV traction, stationary energy storage (utility and commercial), and consumer & industrial cells. By shifting from a 10% price decline to increased project IRR, investors can better justify large-scale grid deployments.
| Metric | U.S. Market Average | Industry Leading Target |
|---|---|---|
| Avg. Pack Price | $120–$140/kWh | < $100/kWh (LFP) |
| Annual Growth | ~58 GWh Added | 25%+ CAGR Forecast |
| Manufacturing Yield | 85-90% | > 95% (Automated) |
| Energy Density | Standard Li-Ion | High-Nickel / Solid-State |
EV battery capacity growth has been the largest share of incremental GWh. Higher energy density (moving toward 300Wh/kg) now allows for 20% longer vehicle range without increasing the physical size of the battery pack, directly solving "range anxiety" for consumers.
"When designing high-capacity layouts, PCB thermal management is critical. We recommend 3oz copper weight for bus bars to handle the surging discharge rates in new 58 GWh+ utility installs. A common pitfall is underestimating the parasitic inductance in the BMS sensing lines."
Pack-level prices have declined substantially. Historically, raw materials accounted for the largest swing; today, economies of scale mean that a 2x increase in factory throughput results in a roughly 15% reduction in assembly costs. This makes domestic sourcing increasingly competitive with overseas imports.
EVs drive large, predictable GWh demand. OEMs are highly sensitive to $/kWh: every $10/kWh reduction adds approximately $600–$800 to the bottom-line profit of a standard long-range EV. Conversely, stationary markets focus on cycle life and "Levelized Cost of Storage" (LCOS).
Battery capacity is typically reported in gigawatt-hours (GWh) for installed energy and GWh/year for manufacturing throughput. It is vital to distinguish between "Nameplate Capacity" (theoretical max) and "Operational Capacity" (actual output).
Short-term moves stem from raw-material price volatility (Lithium Carbonate, Nickel) and logistics costs. Currently, a 10% drop in lithium prices can result in a 2-4% reduction in total pack price within 3-6 months.
Critical indicators include permitted and financed projects, manufacturing commissioning timelines, and interconnection queue progress at the regional ISO/RTO level.
© 2024 Market Data Insights. Professional Analysis for the Energy Sector.


{{ boxName }} ({{ dataList?.length || 0 }} Items)
{{ val.manufacturer || val.en_manufacturer || '' }}
auto.lang_Quantity: {{ val.quantity }}
auto.lang_null