News
2026-03-07

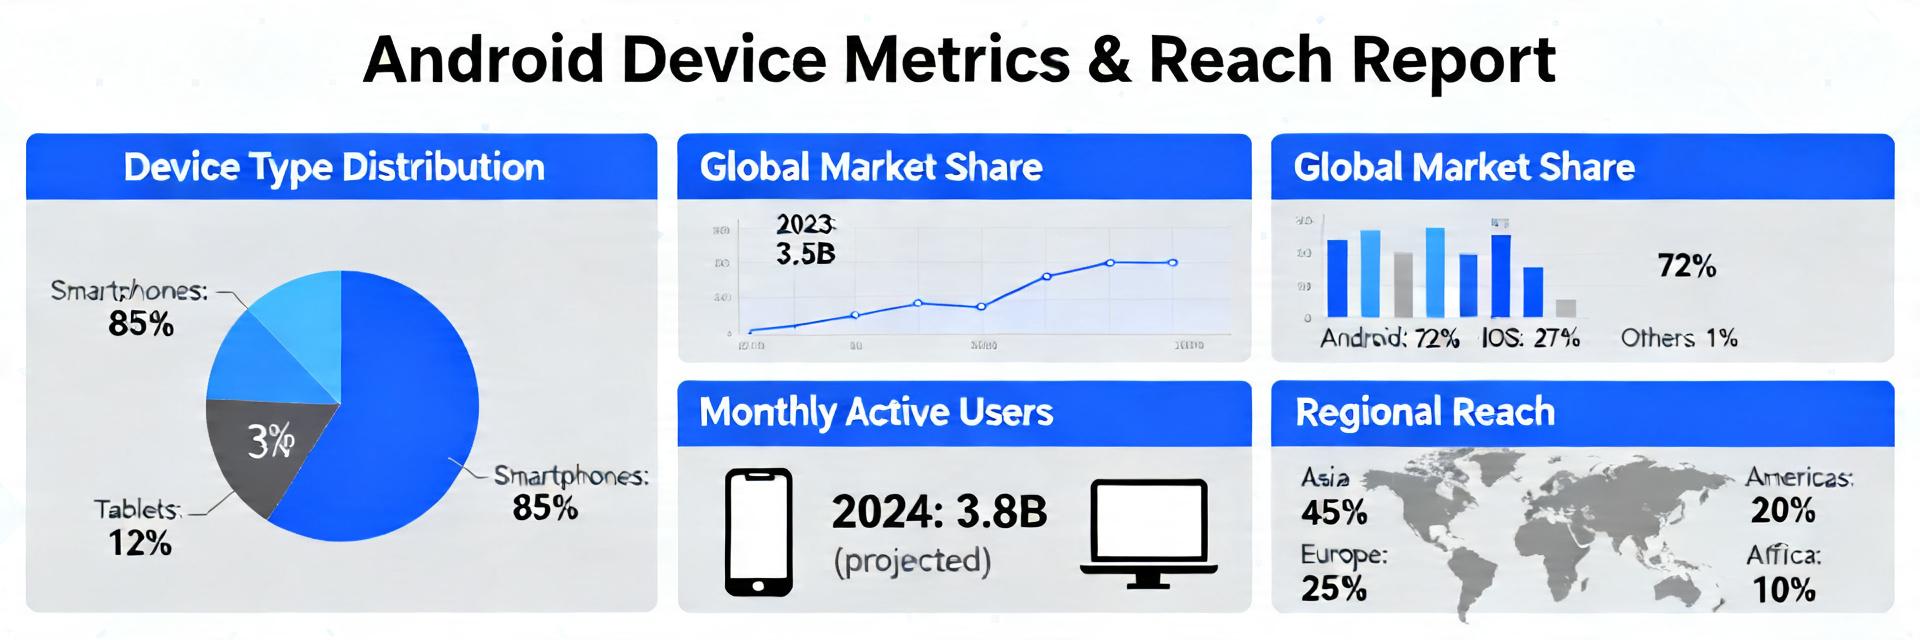
Android runs on 24,000+ distinct device models worldwide; small subsets of models can account for 60–80% of active users in a given country. This report defines which device metrics matter for Android compatibility, shows how to measure and model reach, and provides a prioritization playbook to reduce breakage while expanding user coverage.
This guidance is written for US product managers, engineering leads, QA, and analytics owners balancing quality, coverage, and release velocity. It highlights device metrics and reach modeling so teams can make data-driven tradeoffs between coverage and risk tolerance.
Compatibility risk grows where hardware variety and software permutations intersect. Form factors (phones, tablets, foldables, large-screen/desktop modes, TV/automotive variants) combine with OS differences and OEM customizations to create many vectors where behavior diverges, increasing testing surface and regression risk.
| Metric Category | Legacy/General Focus | Strategic Reach Modeling |
|---|---|---|
| User Reach | Total Downloads | Daily Active Users (DAU) Share |
| Performance | App Launch Time | Jank/Frame Time & ANR by RAM Tier |
| UI Quality | Screen Resolution | Viewport Density & Inset Handling |
| QA Priority | Random Device Testing | Risk × Reach Matrix Prioritization |
Different form factors mean different layout constraints, input modalities, and sensors; OS and OEM layers change default behaviors. Common failures include layout clipping on resizable windows, incorrect orientation handling, and sensor availability mismatches. These manifest as user-visible regressions and higher crash or ANR rates on specific devices—making targeted monitoring essential for Android compatibility.
Platform changes—orientation/resizability defaults, tighter runtime permissions, API deprecations—expand the compatibility surface. Teams should monitor platform release notes, API deprecation lists, and manifest/runtime behavior changes; evolving device metrics must capture signals tied to these shifts so testing and telemetry remain relevant.
Device-level signals are the foundation for prioritization. Track active installs by device model, OS version share, screen resolution/density buckets, CPU/GPU families, RAM tiers, sensor availability, crash rate by device, ANR rate, UI rendering performance, and network-class distribution.
Reach is the percentage of active users covered by a compatibility stance. Compute reach with device-level DAU: Reach = (sum DAU for covered devices) / (total DAU). Use cumulative top-N device curves to set coverage targets (for example, top 50 devices may cover X% of US DAU).
"Don't just look at the raw crash count. A 1% crash rate on a Samsung Galaxy S24 Ultra is a tier-1 emergency because of its high DAU share, whereas a 5% crash rate on a 2017 burner phone might just be a 'monitor' signal. Always weight your telemetry by Reach."
When debugging layout issues on foldables, use the Jetpack WindowManager library to track FoldingFeature states. Testing only on emulators often misses the hinge-specific occlusion zones that real devices encounter.
A risk×reach matrix prioritizes effort: X-axis = reach (high→low), Y-axis = severity/impact (high→low). Populate it with device metrics and incident data to classify devices into must-test, should-test, and monitor-only buckets, aligning test coverage to user impact.
[SVG Placeholder: Reach vs. Risk Matrix Visualization]
Hand-drawn schematic, not a precise circuit diagram.
Symptom: letterboxing or overlap in multi-window. Root cause: missing responsive layouts or deprecated manifest flags. Fix: adopt constraint-based layouts, support window resizing, add resource qualifiers. Telemetry to capture: in-field screenshots (opt-in), device model, OS, and viewport size to validate fixes across high-reach devices.
Symptom: crashes or disabled features on devices lacking expected sensors. Fix: feature-gate by runtime capability checks, provide fallbacks, and run targeted hardware tests on representative CPU/GPU and sensor tiers. Prioritize fixes where device metrics show high reach to maximize impact.
Measure the right device metrics, model reach deliberately, and prioritize testing by risk×reach. Run tactical fixes immediately while investing in strategic capabilities to keep coverage aligned with user impact. These steps reduce breakage and expand reliable user reach for the app ecosystem.
How should teams calculate reach by device model?
Compute reach as the ratio of DAU for a covered device set to total DAU. Sort models by DAU share, cumulatively sum until reaching a desired threshold (e.g., 80%) and mark that set as high-priority. Weight the calculation by active user cohorts to reflect production usage patterns.
Which device metrics are most predictive of regressions?
Crash rate by device model, ANR rate, and median UI frame time correlate strongly with user-visible regressions. Combine those signals with DAU share and OS version to prioritize investigations where impact and reach intersect.
What immediate steps reduce Android compatibility risk?
Enable device-model-based alerts, include top devices in CI/device-farm tests, run staged rollouts per device-group, and instrument viewport and sensor telemetry. These short-term actions quickly surface high-impact issues and buy time for longer-term investments.


{{ boxName }} ({{ dataList?.length || 0 }} Items)
{{ val.manufacturer || val.en_manufacturer || '' }}
auto.lang_Quantity: {{ val.quantity }}
auto.lang_null